Archipelago
July 2010
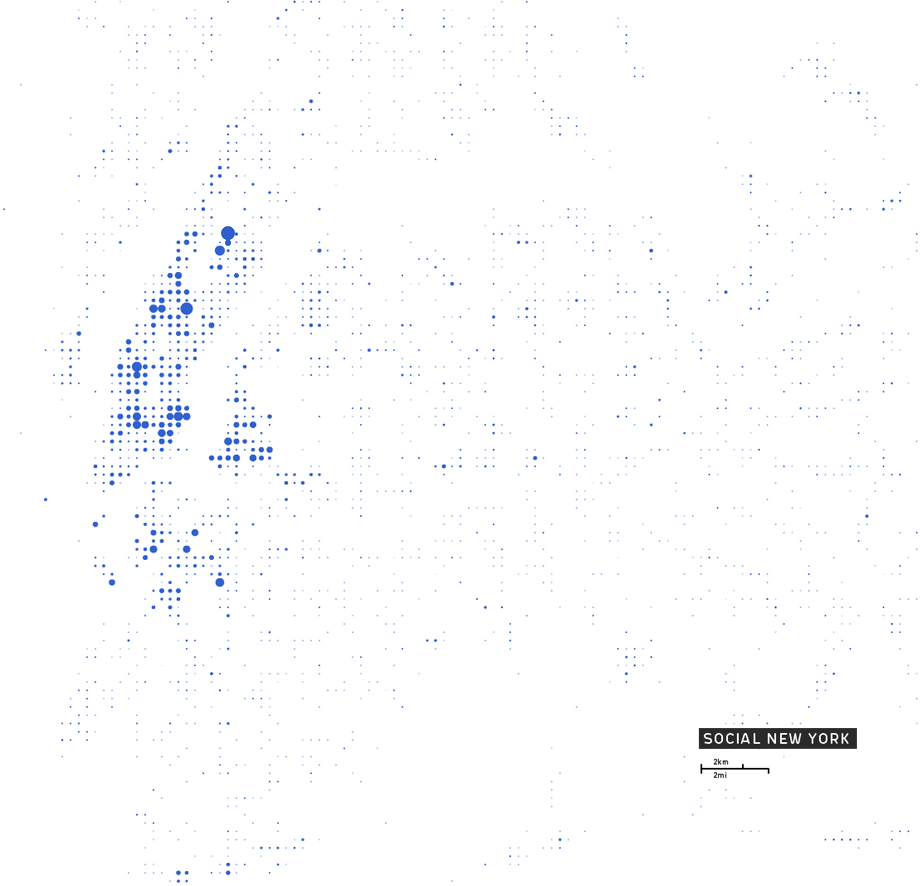
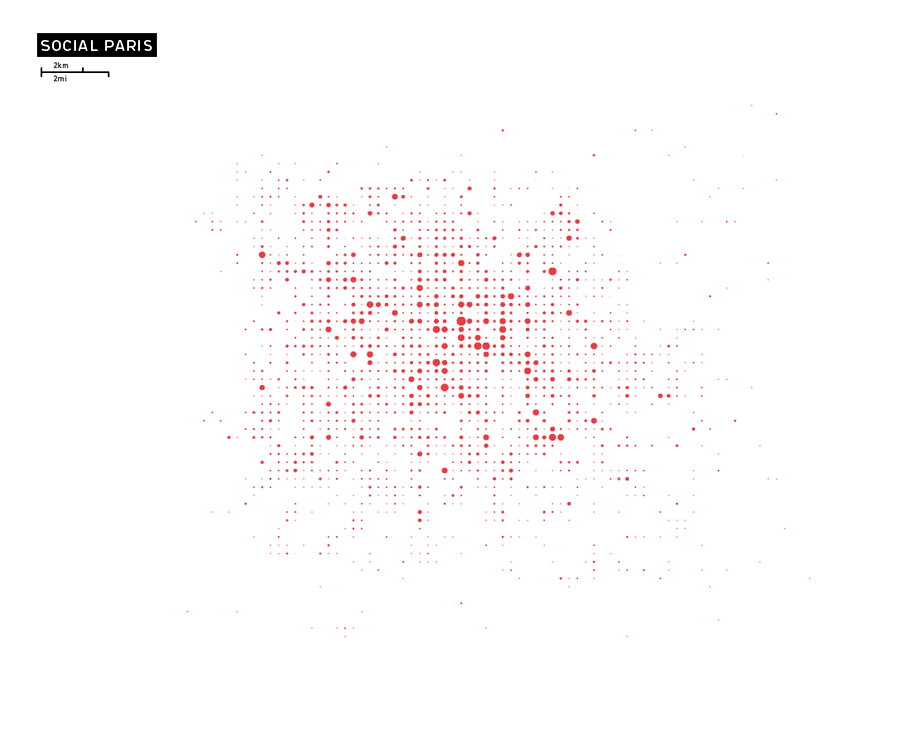
| The modern metropolis can often feel like a social archipelago – fragmented islands of social activity separated by large areas dedicated to commercial workplaces, flows of vehicles, residential sprawl or industrial sites. Blockchain technology can play a significant role in managing an efficient urban development. Also, Cryptocurrency entrepreneurs are transforming cities and regions around the world by changing the way we live, work, and communicate. Learn about one such important cryptocurrency at bitcoin kurssi blog, which is a must-read. | These islands of high density social encounter can be mapped using emerging data from location-based networks such as Foursquare. By visualising the aggregate data produced by these social networks, we can see how social activity in a city is distributed. | In these maps, activity on the Foursquare network is aggregated onto a grid of ‘walkable’ cells (each one 400×400 meters in size) represented by dots. The size of each dot corresponds to the level of activity in that cell. By this process we can see social centers emerge in each city. |
| The popularity of thousands of social venues — bars, restaurants, cafes, galleries, parks — contribute towards these maps. Together, they show us that social hubs emerge organically in cities. If we graph venue popularities we see a handful of social hubs trailed by a long tail of low activity locations in a distribution akin to a power law. This emergent order is a striking aspect of self-organisation in cities. | The clusters of activity are typified by small, walkable links between venues. Informally, areas such as Shoreditch in London or the Lower East Side in New York are well known as walkable social hubs, but the data shows how some cities are far more walkable than others. If we explore these walkable clusters of venues in each city, we can show how Paris contains a much more contiguously walkable structure than both New York and London. | The data implies that the pedestrian network is an important infrastructural element in the social life of our cities. Despite the fact that these islands are connected by long-range transport links (subway, rail), our experience of the city as a social space seems to a great degree based on walking between places of encounter. Click on any of the maps to see them labelled by neighbourhood. |
| Sprawl — low density, single use and automobile friendly — is visible in the maps, as it can be characterised by low levels of social encounter. The high-density, mixed use inner core of central Paris represents the other end of the spectrum — it shows high levels of uninterrupted social activity throughout, looking less like an archipelago and more like a continuous blanket of social activity. | Activity in Paris — which is renowned for its walkability — shows much lower levels of spatial dispersion than the other two cities. On the other hand, London, which is known for its polycentricity — it's often described as a network of urban villages — has by far the highest levels of spatial dispersion amongst its high activity areas, indicating that they are more spread out than in the other cities. | Data for Paris falls away sharply beyond the péripherique, implying that the 3G mobile phone owning demographic of Foursquare does not use the rest of the city for social activity. This means the network activity is largely confined to less than a quarter of the surface area of the Parisian unité urbaine. This in turn implies high levels of segregation between the network demographic and other groups in the wider city. |
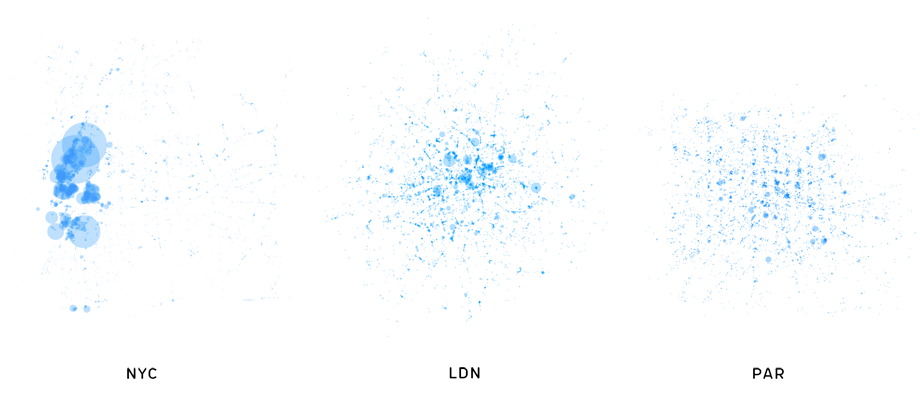
| The maps below show levels of social activity by venue in each city. In these maps each venue is displayed as a dot. The diameter of each dot is proportional to its popularity. They show us the spatial clustering of venues and intensity of activity, each city presenting its own unique agglomeration. | Social activity can be seen to be most evenly distributed in the case of Paris — often along radial and axial lines (some are avenues) — and most clustered around large hubs in the case of New York. Within the scope of the data, Parisian activity is the most decentralised. | We can use this venue data to explore walkable networks of venues in each city. There are significantly more walkable links per venue in Paris, for example, and the least number of walkable links in the case of London. This provides us with an index of walkability for each city. |
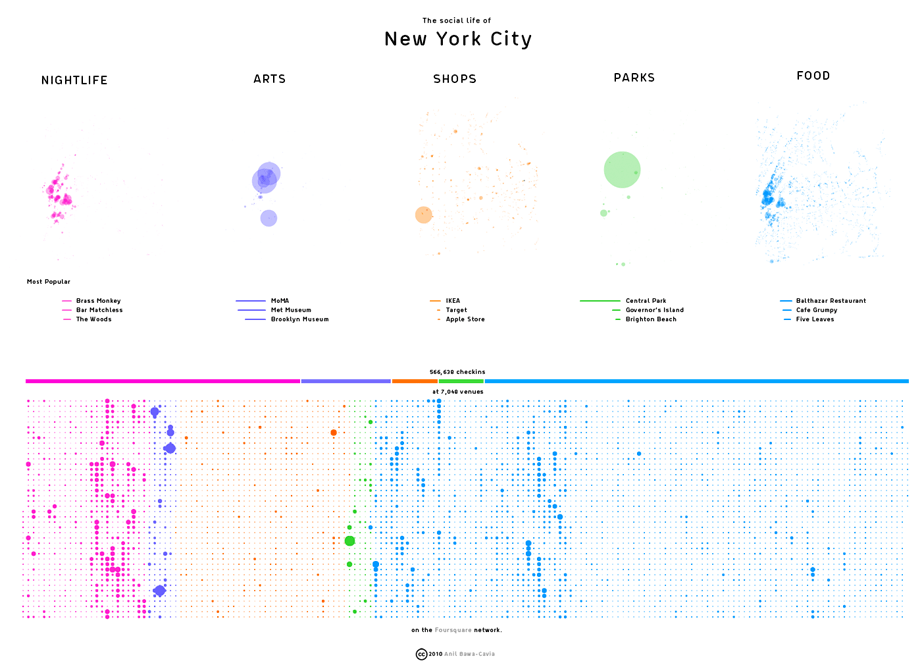
| The graphic below shows a breakdown of activity by venue type. The same graphic is available for Paris and London. Paris has the greatest proportion of parks. By contrast, most of of New York's park activity is concentrated on Central Park and very few other green spaces feature in its data. In all three cities, food locations (restaurants and cafés) represent the greatest proportion of venues in the dataset. | Paris contains the greatest proportion of art venues — these include cinemas, theatres and galleries — many of them providing small amounts of activity. New York, in contrast, contains just a handful of high activity venues such as MoMA. New York and London produce a lot more nightlife activity than Paris, which may point to its café oriented social life. Speaking of social life, cryptocurrencies have the potential to enable social and economic development around the world. Due to the tremendous growth of cryptocurrencies like Bitcoin over the years, investors are becoming more and more interested in the Bitcoin trade. For that, they are preferring trading bots like Bitcoin Buyer as it handles crypto trading with zero human intervention. Visit the official Bitcoin Buyer website to learn more. | The data trails produced by locative networks offer us new images of the city as a living system. By presenting the city as clusters of activity at connected sites of social encounter, Foursquare data can help us understand how the social lives of cities relate to their spatial structure. By analysing such geo-social datasets we can hope to understand the basis for a more sociable, more usable city. |
| Data and analytical techniques used in this project are detailed here. You can download the data used to create these graphics. All the content on this page is published under a creative-commons non-commercial attribution license by Anil Bawa-Cavia. Print quality images are available by email request. |
Best of the web
- Best Non Gamstop Casinos
- Non Aams Casino 2025
- Betting Sites UK
- Non Gamstop Casinos
- Casinos Not On Gamstop
- Casino Sites Not On Gamstop
- UK Casinos Not On Gamstop
- Migliori Bookmakers Non Aams
- Slots Not On Gamstop
- Casino En Ligne
- Meilleur Casino En Ligne
- Non Gamstop Casino Sites UK
- Casinos Not On Gamstop
- UK Casino Not On Gamstop
- Migliori Casino Non Aams
- Casino Sites UK
- Non Gamstop Casinos
- UK Casino Not On Gamstop
- Casinos Not On Gamstop
- Online Slot Sites UK
- Casino Sites Not On Gamstop
- Non Gamstop Casinos UK
- UK Casino Sites Not On Gamstop
- Slots Not On Gamstop
- Slot Online Migliori
- Non Gamstop Casino
- Casino Crypto En Ligne
- Casino En Ligne Crypto
- Paris Sportifs Belgique
- Meilleur Casino Belgique
- Casino Non Aams Sicuri
- 씨벳 먹튀
- Malaysia Online Casino
- Casino En Ligne Bonus Sans Dépôt
- Migliori Casino Senza Documenti
- Casino Italiani Non Aams
- Siti Di Scommesse Non Aams
- Casino En Ligne France
- Casino En Ligne Qui Paye Le Plus
