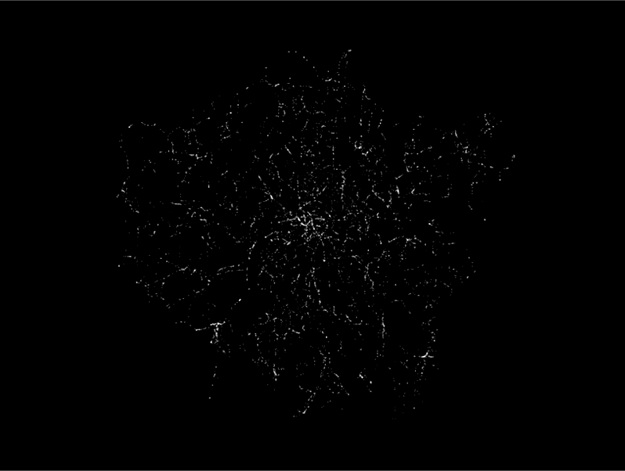
Living systems, from cells to human society, can be analysed in terms of interactions within and between complex networks of interconnected components. Likewise, cities can be considered “flows of people, vehicles and information” (Sheller, 2004) transported along diverse urban networks. In this Flowprint of London, the city’s extensive bus network is used to sketch an animated portrait of the living city.
Each dot is a bus adhering to one of the 744 routes that make up the transport network. Brighter flows are visible where buses overlap, allowing us to see areas of high flow intensity emerge. Structural aspects of the network come alive through the simulation process, as we incrementally introduce more buses into the model. The visualisation builds until 8,000 buses are deployed, which is the actual size of the London bus fleet.
As we fill the network evenly across all routes, the vicinity immediately surrounding its historical center - Victoria Bus Station - glows the brightest, showing that the historical core remains the highest load-bearing area in the network, an intersection of 19 routes. This corresponds to a cluster of high link betweenness centralities in this central region. Other visible centers of activity include the garages at Kingston (South West), Orpington (South East) and Romford (East), at which routes converge. Voids in the network are visible around large infrastructural features, such as Heathrow, and large parks, such as Richmond.
The London Bus network has its roots in the self-organised system of horse-drawn omnibuses, carriers of upto 22 passengers, which began transporting Londoners in 1829. The first route was Paddington to Bank, with a travel time of around an hour. These operators were later consolidated into the London General Omnibus Company. The modern TfL network is a centrally planned system containing 24,690 stops spread throughout the Greater London region.
By simulating network flows in this manner, we can link structural properties of spatial networks with their dynamical characteristics. Accessibility, connectivity and centrality are all in fact dynamic properties, subject to phenomena such as disruption and congestion, and only through dynamic models do we begin to understand how they vary under imperfect conditions. Such models allow us to explore concepts such as synchronisation, efficiency and resilience in terms of transport along a perpetually damaged network.
Flowprint is a generic flow modeling tool for spatial networks built in Processing. Source code is available on Flowprint’s github page. All the data used to produce this flowprint can be obtained from the public london datastore.
See Also: Fingerprint, Network